Brown Dwarf Spectra Useful as Proxies for Exoplanet Spectra
Summary
The spectroscopic component of the Coronagraph Instrument will observe exoplanets across the visible spectrum. Although these exoplanets will be observed in reflected light, the transmission spectra of cold brown dwarfs can serve as proxies for exoplanets because both sets of objects share many of the same intrinsic spectral features.
These observational spectra extend into the near-infrared (~2.5 μm). Redder wavelengths are included so that these same spectra can be used to synthesize colors in the filter sets being designed for the WFI.
Observational Spectra
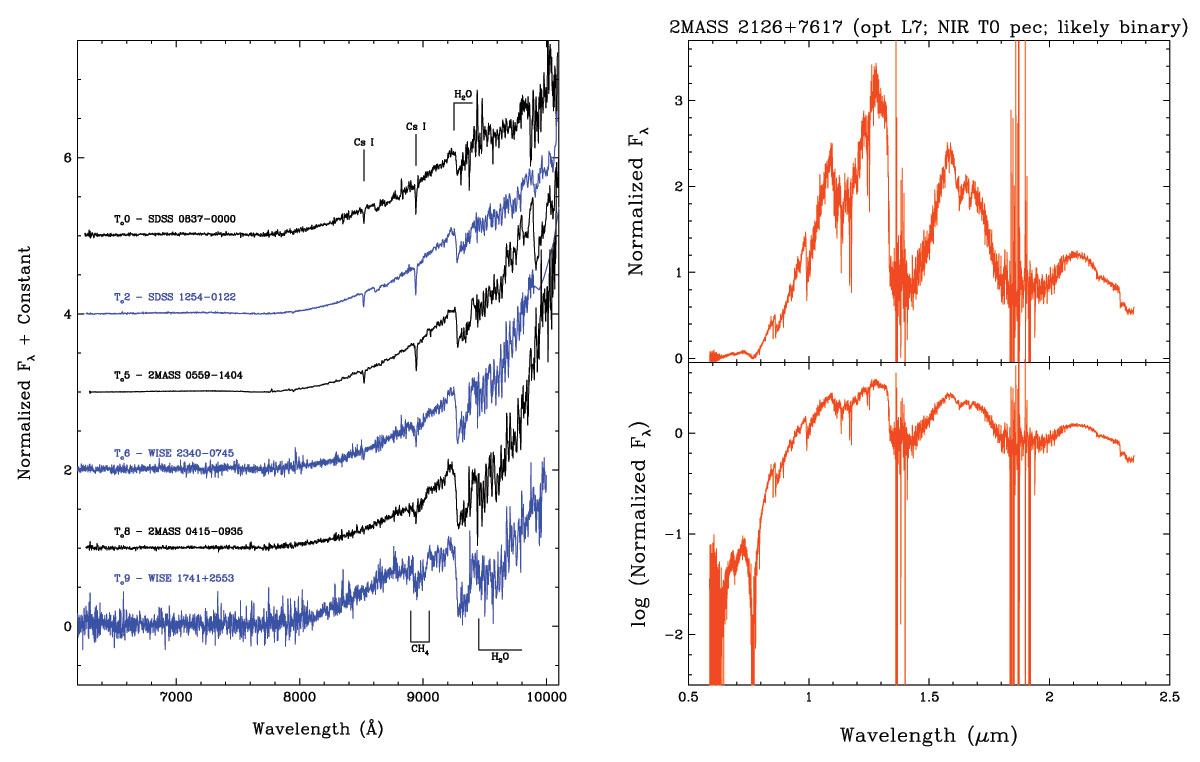
Spectra from the 2MASS and WISE Brown Dwarf Teams
This is a collection of nineteen observed brown dwarf spectra running from mid-L (~1700K) to late-T (~600K) spectral types. These data have been corrected for the effects of telluric absorption across all wavelengths and therefore approximate how spectra of these objects would appear from a space-based platform. These data, which originated from separate optical and near-infrared ground-based instruments, were flux calibrated separately and then rescaled, if necessary, so that fluxes match over the wavelength region in common (generally 0.95-1.05 μm). The flux calibration itself was then multiplied by a slit-loss correction factor so that synthesized near-infrared J, H, K values would match the observed 2MASS (or other published) photometry, as listed in the headers of each file.
If you find these spectra useful, we ask that you credit the original publication references listed in the table below and also in the file headers.